September means that it is time again for my annual Iowa farm report, the sixth edition in this series. As readers of prior postings will remember, my day job is Professor of International Agricultural Policy at Stanford University. However, my wife and I also own a 200-acre farm near Marion, Iowa, where we spend summers watching over corn, soybean, and alfalfa fields, and gazing out at a growing cow-calf herd.
After all these years, it is still difficult for me to describe the differences in pace, politics, and age structure in Iowa relative to California. I am now 81, and at Stanford I feel ancient; in Iowa, I am just one of the boys, since 41 percent of farm owners are 75 or older.
This summer’s weather, especially rainfall, has been almost perfect for crops in our area. Although western Iowa and the northern Great Plains experienced drought, we are expecting record yields of both corn and soybeans, possibly reaching 225 and 55 bushels per acre, respectively. Unfortunately, December corn prices are only about $3.50 per bushel. This level is just half of what it was five years ago. The old adage that farmers should raise more hell and less corn has taken on new meaning. Average prices of Iowa farmland have slipped from about $9,000 to $7,000 per acre during the past five years (though still remarkably high relative to the $2,000 that prevailed in 2000). Renters of land are also feeling price pressures. Average cash rents have fallen about 10 percent over the past two years and now average about $230 per acre in our part of the state.
The difference between the “almost perfect” weather described above and an absolute disaster measured about three miles this year. During much of June, our area was hit with very unstable air. The worst episode was on June 28 when an EF-2 tornado came barreling right at our farm. The picture below was taken out of the west window before we scampered down to the safe room in our basement. At the last minute, the tornado veered slightly, going just between our farm and the bustling county fair (also shown) four miles to the north. The tornado then touched down a few miles to our east, crushed the historic Brown farm, and mostly destroyed the small town of Prairieburg. Amazingly, both our farm and the fair were completely spared except for a few broken tree limbs.
There is an interesting footnote on risk to this story. When I show the tornado picture to my California friends they cannot understand why I would live in such a risky place; however, my Iowa friends frequently remark that they cannot comprehend how I can live in the risky state of California with its earthquakes. Risk, like beauty, is sometimes in the eyes of the beholder.
Photo: Karla Hogan (just to the west of our house)
Photo: David Roll (fair)Not everything from the sky was bad this year, although one other episode also turned out to be a non-event. Our region was to have had 90 percent coverage during the eclipse. We were completely socked in by clouds, however, and could see absolutely nothing on this historic occasion. On the other hand, airplane applications of fungicides and pesticides were greater than I can ever remember. A combination of new weeds to the region (water hemp and Palmer amaranth) and growing weed resistance in Roundup-ready soybeans are causing increased problems for farmers. As for the applicators, I never cease to be impressed by the skill (craziness?) of those pilots who fly at 50 feet or less, dodging power lines, while managing controls of the spray equipment as well as the plane.
Describing another “sky” event at the farm requires that I first remove considerable amounts of egg from my face. Stanford sits in the middle of Silicon Valley, and over the past decade perhaps a dozen firms have visited my office regarding agricultural applications. Particularly in the earlier years, I assured them that precision agriculture was overrated and that drones would never have a place in agriculture. Those were not among my better forecasts!
My conjecture is that more than 90 percent of the fields in Iowa have now been laid out with GPS grid maps that permit automatic steering of tractors and harvesters. Famers rarely steer or look ahead; rather they mostly look backward at planters and other equipment. From gauge-filled cabs that resemble cockpits, farmers monitor yields, seed-planting rates, and fertilizer applications in ways that produce field maps for each 10x10 meter sub-plot. In some sense, producers already have more data than they can assimilate, so one could reasonably ask, can drones really help? It turns out that they can, and they can do so for only a small investment.
The high quality drone shown below, complete with two 30-minute batteries, costs about $2,000, with quality determined mostly by the precision of its camera. (That sum may not be petty cash, but it is not in the same league as a $600,000 combine-harvester either.) For mapping work, drones are connected to an off-site service center that costs about $100 per month. They produce video in real-time, snap images as well, and are proving useful in determining if the number of emergent plants (really the lack of plants) on areas that may require replanting; in checking fields for “wet spots” after rains for indicators of future tiling needs; and watching the cow herd from the back porch, as is also shown below. Applications are ever underway that can take the temperatures of animals via intricate heat-sensing devices.
Once corn grows to chest high, it is impossible to walk or drive through fields to isolate areas with particular weed problems or to view pest damage. These drones are also tied in with GPS systems, so that entire fields can be mapped “automatically” at very high resolution. A 100-acre field can be mapped within the 25 minutes of a single battery-powered flight. (The further good news is that the machines are smart enough to return to their takeoff point before losing power.) Drones seem to be here to stay because they save labor, generate useful data, and help improve farm-management practices
Photo: Margaret Meythaler (drone demo)
Photo: Mitch Meythaler (field map by drone—August 5th corn plant health (potential yield); red is low, green is high; dark red areas are waterways and fence rows; sandy soils show red to the north, and red streaks indicate water erosion.)
Photo: Mitch Meythaler (part of cow herd by drone)Drones, however, have not affected my image of the old limestone “restaurant” where neighborhood farmers gather about 8 a.m. Most of the “action” is around the big table where truly terrible coffee is self-served. Payment is on the honor system, since there is rarely a waitress around. Maybe it was just my imagination, but farmer discussions seemed more somber and narrower this year, despite the good weather. Perhaps it is the third successive year of low prices, or the uncertainty about corn exports to Mexico and China, or the general chaos in Washington, D.C. Perhaps it also reflects the ethnic and religious homogeneity of the local population. Stanford’s undergraduate student body, for example, is only 45 percent white. However, during the course of all of my personal interactions during four months in Iowa, I encountered only three minority persons – two medical doctors at the local hospital whose families came from India, and one African-American. Homogeneity and diversity make for different worldviews and different conversations – neither being necessarily better or worse, but certainly different.
The most animated discussion I participated in concerned technology gone astray. Large chemical companies, such as Monsanto and DuPont, have purchased many seed companies, thereby assuring markets for their particular brand of chemicals. In the case of corn, for example, a particular GMO variety has been bred such that, when sprayed by a particular brand, all plants are killed except for the corn. Spraying these herbicides requires training and specialized equipment, and herbicide applications are frequently hired – typically for about $8 per acre, plus the cost of chemicals. As part of the new technology, the specific corn variety and the particular brand of spray are entered into the software that then uses GPS maps to control the actual spraying. But what happens when the hired vendor, in this case a local co-operative, enters the wrong variety into the computer, as happened to two of our neighbors? The spray killed the weeds, but it also killed the corn. At that point, it was too late in the season to replant. These fields were sorry looking messes, and the debate still continues as to who is liable and for how much.
Another hot button item this year centered on the purchase of farmland for housing developments. Farmers almost universally regard such investments as unwarranted intrusions into their space. (The proposed relocation of the county landfill generated even more vehement responses.) The housing argument typically took two forms: more houses mean more children and therefore higher property taxes for schools; and theses houses take “all of the good Iowa farmland”, which is needed to feed the world. There is some correctness to the former argument, but as to the latter assertion – not so much. I argued that for the last five years, total acres of corn and soybeans in Iowa had trended upward rather than downward, and that furthermore, both current and future problems of hunger were driven primarily by poverty, not the lack of corn and soybean supplies. This comment was not regarded as being helpful to the coffee-crowd discussion!
Politics are rarely discussed in these conversations – at least in my presence. However, I sense several things. Although Iowans voted for Donald Trump, I think it was because they generally disliked him less than they disliked Hilary Clinton. Most of my neighbors now simply seem embarrassed by what is happening. My California friends continue to ask me about what Iowans think and what they believe in. There is not much open discussion about these matters either, which made a July poll of the Des Moines Register all the more interesting. When given a choice of 17 options of whom they believed, the top six in order were: the armed forces, God, the Iowa Department of Natural Resources, local schools, the Farm Bureau, and the FBI. The three options they believed in least, also in order from the bottom, were the U.S. Congress, the media, and the President. I do not know what a comparable survey in California would look like, but I believe that it would be considerably different.
Photo: Daryl Hamey (2016 calves — the red heifer is now bred, and the black baldy steer is now in the freezer!)At the end of last year’s report, I left readers hanging with the question of whether our seemingly disinterested yearling bull would produce a crop of calves. It turns out that my fears were misplaced, and that he was indeed working the night shift. Our problems were in fact on the female side—our best cow did not conceive, and another of our good cows produced a sickly calf that ended up being bottle-fed by my wife. To compete the story, we again rented a red Angus bull – the same one in fact that we had last year – and he is now a much larger two-year old. But he is still no competition for “Upward”, the strangely named Angus super-bull winner at the Iowa State Fair that weighed 2,798 pounds.
I leave in a week for yet another year of teaching and research at Stanford. I have only a limited number of lectures scheduled, and most of my time will be directed toward research on the growing importance of tropical vegetable oils, particularly from oil palm in Indonesia. Palm oil has recently replaced soybean oil as the most important in world commerce, so even when I am in California, there remain important and unusual Iowa connections.
My neighbor says that I must leave Iowa soon – because of the upcoming weather. In true Almanac fashion, he confidently predicts an early and harsh winter ahead. His evidence – the deer are weaning their young at an early date, and are busy consuming great quantities of corn from our fields, so as to layer on fat for the winter. We might even be able to see the extent of their gluttony on our autumn yield maps!
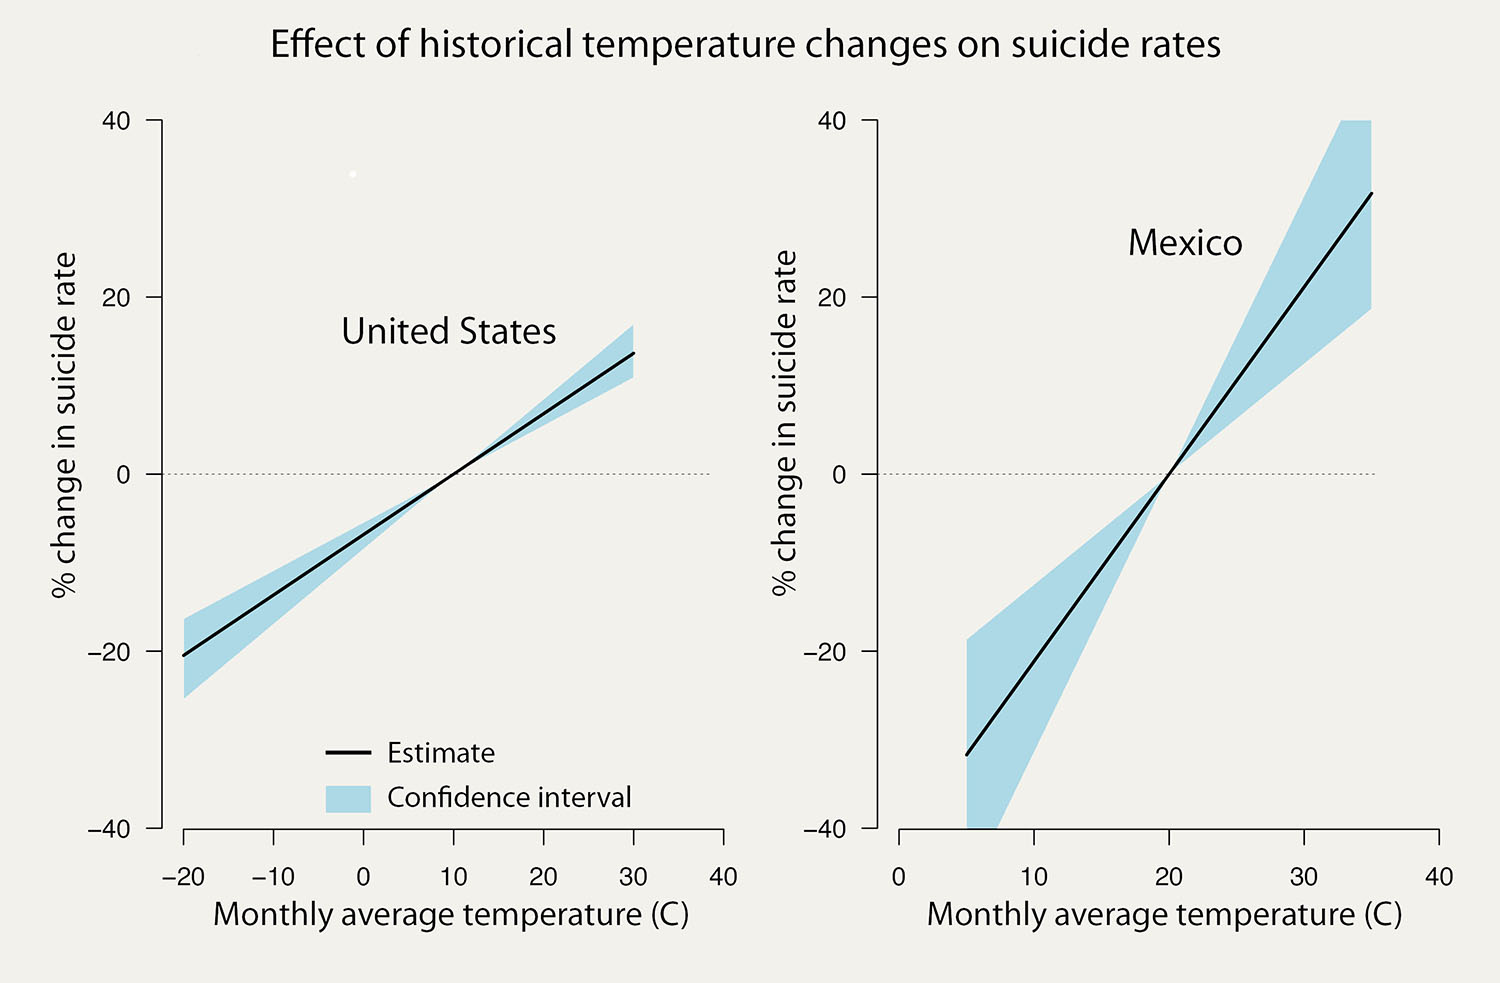 Effects of historical temperature changes on suicide rates are shown for the U.S. and Mexico. (Image credit: Marshall Burke)


