International Development
Paragraphs

Wheat is the most important staple crop grown in Australia, and Australia is one of the top wheat exporting countries globally. Timely and reliable wheat yield prediction in Australia is important for regional and global food security. Prior studies use either climate data, or satellite data, or a combination of these two to build empirical models to predict crop yield. However, though the performance of yield prediction using empirical methods is improved by combining the use of climate and satellite data, the contributions from different data sources are still not clear. In addition, how the regression-based methods compare with various machine-learning based methods in their performance in yield prediction is also not well understood and needs in-depth investigation. This work integrated various sources of data to predict wheat yield across Australia from 2000 to 2014 at the statistical division (SD) level. We adopted a well-known regression method (LASSO, as a benchmark) and three mainstream machine learning methods (support vector machine, random forest, and neural network) to build various empirical models for yield prediction. For satellite data, we used the enhanced vegetation index (EVI) from MODIS and solar-induced chlorophyll fluorescence (SIF) from GOME-2 and SCIAMACHY as metrics to approximate crop productivity. The machine-learning based methods outperform the regression method in modeling crop yield. Our results confirm that combining climate and satellite data can achieve high performance of yield prediction at the SD level (R2 ˜ 0.75). The satellite data track crop growth condition and gradually capture the variability of yield evolving with the growing season, and their contributions to yield prediction usually saturate at the peak of the growing season. Climate data provide extra and unique information beyond what the satellite data have offered for yield prediction, and our empirical modeling work shows the added values of climate variables exist across the whole season, not only at some certain stages. We also find that using EVI as an input can achieve better performance in yield prediction than SIF, primarily due to the large noise in the satellite-based SIF data (i.e. coarse resolution in both space and time). In addition, we also explored the potential for timely wheat yield prediction in Australia, and we can achieve the optimal prediction performance with approximately two-month lead time before wheat maturity. The proposed methodology in this paper can be extended to different crops and different regions for crop yield prediction.

All Publications button
1
Publication Type
Journal Articles
Publication Date
Journal Publisher
Agricultural and Forest Meteorology
Authors
Yaping Cai
David Lobell
Andries B.Potgieter, Shaowen Wanga, Jian Peng, Tianfang Xu, Senthold Assen, Yongguang Zhang, Liangzhi You, Bin Peng
Paragraphs

Understanding the causes of economic inequality is critical for achieving equitable economic development. To investigate whether global warming has affected the recent evolution of inequality, we combine counterfactual historical temperature trajectories from a suite of global climate models with extensively replicated empirical evidence of the relationship between historical temperature fluctuations and economic growth. Together, these allow us to generate probabilistic country-level estimates of the influence of anthropogenic climate forcing on historical economic output. We find very high likelihood that anthropogenic climate forcing has increased economic inequality between countries. For example, per capita gross domestic product (GDP) has been reduced 17–31% at the poorest four deciles of the population-weighted country-level per capita GDP distribution, yielding a ratio between the top and bottom deciles that is 25% larger than in a world without global warming. As a result, although between-country inequality has decreased over the past half century, there is ∼90% likelihood that global warming has slowed that decrease. The primary driver is the parabolic relationship between temperature and economic growth, with warming increasing growth in cool countries and decreasing growth in warm countries. Although there is uncertainty in whether historical warming has benefited some temperate, rich countries, for most poor countries there is >90% likelihood that per capita GDP is lower today than if global warming had not occurred. Thus, our results show that, in addition to not sharing equally in the direct benefits of fossil fuel use, many poor countries have been significantly harmed by the warming arising from wealthy countries’ energy consumption.

All Publications button
1
Publication Type
Journal Articles
Publication Date
Journal Publisher
Proceedings of the national Academy of Sciences of the United States of America
Authors
Noah Diffenbaugh
Marshall Burke
Paragraphs

Eradicating hunger and malnutrition is a key development goal of the twenty first century. This paper addresses the problem of optimally identifying seed varieties to reliably increase crop yield within a risk-sensitive decision making framework. Specifically, a novel hierarchical machine learning mechanism for predicting crop yield (the yield of different seed varieties of the same crop) is introduced. This prediction mechanism is then integrated with a weather forecasting model and three different approaches for decision making under uncertainty to select seed varieties for planting so as to balance yield maximization and risk. The model was applied to the problem of soybean variety selection given in the 2016 Syngenta Crop Challenge. The prediction model achieved a median absolute error of 235 kg/ha and thus provides good estimates for input into the decision models. The decision models identified the selection of soybean varieties that appropriately balance yield and risk as a function of the farmer’s risk aversion level. More generally, the models can support farmers in decision making about which seed varieties to plant.

All Publications button
1
Publication Type
Journal Articles
Publication Date
Journal Publisher
Environment Systems and Decisions
Authors
Huaiyang Zhong, Xiaocheng Li
David Lobell
Stefano Ermon
Margaret Brandeau
Authors
Taylor Kubota
News Type
News
Date
Paragraphs

As more of the greenhouse gas carbon dioxide enters the atmosphere, leading to climate change, crops might carry fewer nutrients, like zinc and iron. Stanford researchers explored this trend and regions most likely to be hurt by it.

As the climate changes, where plants grow best is predicted to shift. Crops that once thrived as a staple in one region may no longer be plentiful enough to feed a community that formerly depended on it. Beyond where plants grow, there’s also the issue of how they grow. Evidence suggests that plants grown in the presence of high carbon dioxide levels aren’t as nutritious.

“Zinc is critical for the immune system and zinc deficiency makes pneumonia, diarrheal illness, malaria more difficult for the body to combat,” said Eran Bendavid, associate professor of medicine. “Iron deficiency has all sorts of manifestations, from lethargy and feeling ill to broader effects, like worse performance in school.”

David Lobell, professor of Earth system science in the School of Earth, Energy & Environmental Sciences, has been studying the relationship between climate change and crops. He was drawn to the relationship between C02 and crop nutrition because his work pairs findings from scientific models with concrete observations.

“Any time you’re looking at data, you need observations that correspond to the conditions you’re trying to understand. But you have to be creative to find data sets that allow for this kind of validation,” Lobell said.

Years of life lost due to less nutritious crops

The researchers estimated how many additional years of healthy life would be lost from 2015 to 2050 due to carbon dioxide-related declines in zinc and iron in crops. This data represents the base case scenario, where carbon dioxide levels climb relatively unabetted. These predictions start at 2015 but health disparities between the regions already existed: at that time, the African Region was losing approximately four times as many healthy years due to these nutrient insufficiencies as the European Region. (Image credit: Yvonne Tang)

Last year, Lobell, Bendavid and Stanford collaborators including management science and engineering graduate student Christopher Weyant, published a paper in which they projected how crop nutrition – zinc and iron levels – will respond to climate change in the coming decades and what that might mean for human health. They looked at two different scenarios, one a base case scenario in which carbon dioxide levels climb relatively unabetted, resulting in a nearly 40 percent increase in carbon dioxide concentrations by 2050. In the other, the group assumed global temperatures would remain within 2 degrees Celsius of pre-industrial levels, as proposed by the Paris Agreement.

For each scenario, they calculated how many years of healthy life people around the world would lose due to illness, disability or death as a result of less iron and zinc in their diet. In the base case scenario, they also explored how different health care interventions, including zinc or iron supplementation, and disease control programs for pneumonia, diarrhea and malaria could help.

Reductions in years of life lost through different interventions

The researchers estimated total years of healthy life lost from 2015 to 2050 due to carbon-dioxide-related zinc and iron deficiencies, with different interventions. The researchers’ predictions showed that keeping to the Paris Agreement goals and reducing greenhouse gas emissions results in far better health outcomes than other solutions, such as supplementing nutrients. (Image credit: Yvonne Tang)

They projected that, by far, the most effective way to reduce the consequences of this carbon dioxide-induced disease burden was to limit the amount of carbon dioxide in the atmosphere. In their model, sticking to Paris Agreement goals avoided 48.2 percent of the healthy years lost to carbon dioxide-induced nutritional diseases. In contrast, providing health care interventions only reduced years of healthy life lost by 26.6 percent.

As with other research on the impact of climate change, these nutritional deficiencies are more likely to affect the poorest people first and most severely. But Lobell cautions against assuming it is a problem happening somewhere else.

“Even in a world that is getting more and more food secure, malnutrition would be among the biggest – if not the biggest – health effects of climate change,” Lobell said.

Lobell is now studying what large and small farms are currently doing to combat climate change and the effectiveness of those efforts. One aspect of this work is his lab’s analysis of high-resolution images from satellites to estimate crop yields from space.

Additional co-authors of the paper are Margaret Brandeau and Marshall Burke of Stanford. Senior author was Sanjay Basu of Stanford. Bendavid is also a member of the Maternal & Child Health Research Institute (MCHRI) and an affiliate of the Stanford Woods Institute for the Environment. Lobell is also a senior fellow at the Freeman Spogli Institute for International Studies, at the Stanford Woods Institute for the Environment and at the Stanford Institute for Economic Policy Research. He is also an affiliate of the Precourt Institute for Energy.

The way we treat the planet has direct consequences on human health. This series of stories explores some of those consequences and what we can do to lessen the risks.

All News button
1
Paragraphs

The practice of planting winter cover crops has seen renewed interest as a solution to environmental issues with the modern maize- and soybean-dominated row crop production system of the US Midwest. We examine whether cover cropping patterns can be assessed at scale using publicly available satellite data, creating a classifier with 91.5% accuracy (.68 kappa). We then use this classifier to examine spatial and temporal trends in cover crop occurrence on maize and soybean fields in the Midwest since 2008, finding that despite increased talk about and funding for cover crops as well as a 94% increase in cover crop acres planted from 2008–2016, increases in winter vegetation have been more modest. Finally, we combine cover cropping with satellite-predicted yields, finding that cover crops are associated with low relative maize and soybean production and poor soil quality, consistent with farmers adopting the practice on fields most in need of purported cover crop benefits. When controlling for invariant soil quality using a panel regression model, we find modest benefits of cover cropping, with average yield increases of 0.65% for maize and 0.35% for soybean. Given these slight impacts on yields, greater incentives or reduced costs of implementation are needed to increase adoption of this practice for the majority of maize and soybean acres in the US.

All Publications button
1
Publication Type
Journal Articles
Publication Date
Journal Publisher
Environmental Research Letters
Authors
George Azzari
David Lobell
Paragraphs

Millions of people worldwide are absent from their country’s census. Accurate, current, and granular population metrics are critical to improving government allocation of resources, to measuring disease control, to responding to natural disasters, and to studying any aspect of human life in these communities. Satellite imagery can provide sufficient information to build a population map without the cost and time of a government census. We present two Convolutional Neural Network (CNN) architectures which efficiently and effectively combine satellite imagery inputs from multiple sources to accurately predict the population density of a region. In this paper, we use satellite imagery from rural villages in India and population labels from the 2011 SECC census. Our best model achieves better performance than previous papers as well as LandScan, a community standard for global population distribution.

All Publications button
1
Publication Type
Working Papers
Publication Date
Journal Publisher
AAAI/ACM Conference
Authors
Wenjie Hu, Jay Harshadbhai Patel, Zoe-Alanah Robert, Paul Novosad, Samuel Asher, Zhongyi Tang
Marshall Burke
David Lobell
Stefano Ermon

Y2E2 Bldg, 473 VIA ORTEGA
Dept. Center on Food Security - Room 349
Stanford, CA 94305


0
img_3988.jpg

Stefania joined FSE as a research data analyst in March 2018 where she works with David Lobell on designing, implementing, and applying new satellite-based monitoring techniques to study several aspects of food security. 

Her current focuses include estimates of crop yields, crop classification, and detection of management practices in Africa and India using a variety of satellite sensors including Landsat (NASA/USGS), Sentinel 1 and 2 (ESA), combined with crop modeling and machine learning techniques.

Research Data Analyst
Date Label
Paragraphs

Companies' sustainable sourcing practices play an increasing role in addressing the social and environmental challenges in agricultural supply chains. Yet the approaches companies take to regulate their supply chains continue to evolve. I use the chocolate industry as a critical case to explore how and why companies have changed their approaches to sustainable cocoa sourcing over the last 20 years. Drawing on an analysis of 205 company documents, 95 newspaper articles and over 50 in‐depth interviews, I trace the evolution of chocolate manufacturers' sustainable sourcing practices from a focus on industry initiatives to a commitment to sustainability certification and now to companies increasingly moving toward own‐supply chain programs. These shifts can in part be explained by the evolving salience of different stakeholder groups over time. This study highlights the dynamic nature of sustainable sourcing practice adoption and suggests companies are building upon previous strategies to incorporate more stakeholder voices over time.

 
All Publications button
1
Publication Type
Journal Articles
Publication Date
Journal Publisher
Business Strategy and Development
Authors
Paragraphs

The extent to which armed conflicts—events such as civil wars, rebellions, and interstate conflicts—are an important driver of child mortality is unclear. While young children are rarely direct combatants in armed conflict, the violent and destructive nature of such events might harm vulnerable populations residing in conflict-affected areas. A 2017 review estimated that deaths of individuals not involved in combat outnumber deaths of those directly involved in the conflict, often more than five to one. At the same time, national child mortality continues to decline, even in highly conflict-prone countries such as Angola or the Democratic Republic of the Congo. With few notable exceptions, such as the Rwandan genocide or the ongoing Syrian Civil War, conflicts have not had clear reflections in national child mortality trends.


 The Global Burden of Disease study estimated that, since 1994, conflicts caused less than 0·4% of deaths of children younger than 5 years in Africa, raising questions about the role of conflict in the global epidemiology of child mortality. The extent to which conflict matters to child mortality therefore remains largely unmeasured beyond specific conflicts. In Africa, conflict-prone countries also have some of the highest child mortality, but this might be a reflection of generalised underdevelopment resulting in proneness to conflict as well as high child mortality, rather than a direct relationship. In this analysis we aimed to shed new light on the effects of armed conflict on child mortality in Africa. We established the effects on child mortality of armed conflict in whom conflict-related deaths are not the result of active involvement in conflict, but of other consequences of conflict. We examined the duration of lingering conflict effects, and the geographical breadth of the observed effects, using geospatially explicit information on conflict location and number of conflict-related casualties. We then used our findings to estimate the burden of armed conflict on children younger than 5 years in Africa.


All Publications button
1
Publication Type
Journal Articles
Publication Date
Journal Publisher
The Lancet
Authors
Zachary Wagner
Sam Heft-Neal
Zulfiqar A Bhutta,Robert E Black
Marshall Burke
Eran Bendavid
Authors
James Urton
News Type
News
Date
Paragraphs

Scientists have already warned that climate change likely will impact the food we grow. From rising global temperatures to more frequent "extreme" weather events like droughts and floods, climate change is expected to negatively affect our ability to produce food for a growing human population.

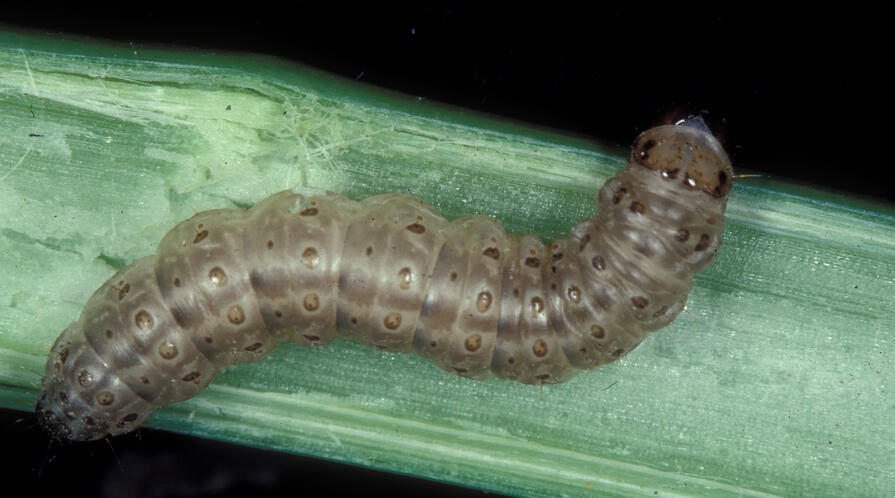
But new research is showing that climate change is expected to accelerate rates of crop loss due to the activity of another group of hungry creatures — insects. A paper published Aug. 31 in the journal Science reports that insect activity in today's temperate, crop-growing regions will rise along with temperatures. Researchers project that this activity, in turn, will boost worldwide losses of rice, corn and wheat by 10-25 percent for each degree Celsius that global mean surface temperatures rise. Just a 2-degree Celsius rise in surface temperatures will push the total losses of these three crops each year to approximately 213 million tons.

"Global warming impacts on pest infestations will aggravate the problems of food insecurity and environmental damages from agriculture worldwide," said co-author Rosamond Naylor, a professor in the Department of Earth System Science at Stanford University and founding director of the Center on Food Security and the Environment. "Increased pesticide applications, the use of GMOs, and agronomic practices such as crop rotations will help control losses from insects. But it still appears that under virtually all climate change scenarios, pest populations will be the winners, particularly in highly productive temperate regions, causing real food prices to rise and food-insecure families to suffer."

In 2016, the United Nations estimated that at least 815 million people worldwide don't get enough to eat. Corn, rice and wheat are staple crops for about 4 billion people, and account for about two-thirds of the food energy intake, according to the UN Food and Agriculture Organization. 

To investigate how insect herbivory on crops might affect our future, the team looked at decades of laboratory experiments of insect metabolic and reproductive rates, as well as ecological studies of insects in the wild. Unlike mammals, insects are ectothermic, which means that their body temperature tracks the temperature of their environment. Thus, the air temperature affects oxygen consumption, caloric requirements and other metabolic rates.

The past experiments that the team studied show conclusively that increases in temperature will accelerate insect metabolism, which boosts their appetites, at a predictable rate. In addition, increasing temperatures boost reproductive rates up to a point, and then those rates level off at temperature levels akin to what exist today in the tropics.

"We expect to see increasing crop losses due to insect activity for two basic reasons," said co-lead and corresponding author Curtis Deutsch, a University of Washington associate professor of oceanography. "First, warmer temperatures increase insect metabolic rates exponentially. Second, with the exception of the tropics, warmer temperatures will increase the reproductive rates of insects. You have more insects, and they're eating more."

The researchers found that the effects of temperature on insect metabolism and demographics were fairly consistent across insect species, including pest species such as aphids and corn bores. They folded these metabolic and reproductive effects into a model of insect population dynamics, and looked at how that model changed based on different climate change scenarios. Those scenarios incorporated information based on where corn, rice and wheat — the three largest staple crops in the world — are currently grown.

For a 2-degree Celsius rise in global mean surface temperatures, their model predicts that median losses in yield due to insect activity would be 31 percent for corn, 19 percent for rice and 46 percent for wheat. Under those conditions, total annual crop losses would reach 62, 92 and 59 million tons, respectively.

The researchers observed different loss rates due to the crops' different growing regions, Deutsch said. For example, much of the world's rice is grown in the tropics. Temperatures there are already at optimal conditions to maximize insect reproductive and metabolic rates. So, additional increases in temperature in the tropics would not boost insect activity to the same extent that they would in temperate regions – such as the United States' "corn belt."

The team notes that farmers and governments could try to lessen the impact of increased insect metabolism, such as shifting where crops are grown or trying to breed insect-resistant crops. But these alterations will take time and come with their own costs.

"I hope our results demonstrate the importance of collecting more data on how pests will impact crop losses in a warming world — because collectively, our choice now is not whether or not we will allow warming to occur, but how much warming we're willing to tolerate," said Deutsch.

Co-lead author is Joshua Tewksbury, director of Future Earth at the University of Colorado, Boulder. Additional co-authors are Michelle Tigchelaar, a UW research scientist in the Department of Atmospheric Sciences; David Battisti, a UW professor of atmospheric sciences; Scott Merrill, a research assistant professor of agriculture and life sciences at the University of Vermont; and Raymond Huey, a UW professor emeritus of biology. The research was funded by the National Science Foundation and the Gordon and Betty Moore Foundation.

By James Urton, University of Washington


Hero Image
All News button
1
Subscribe to International Development